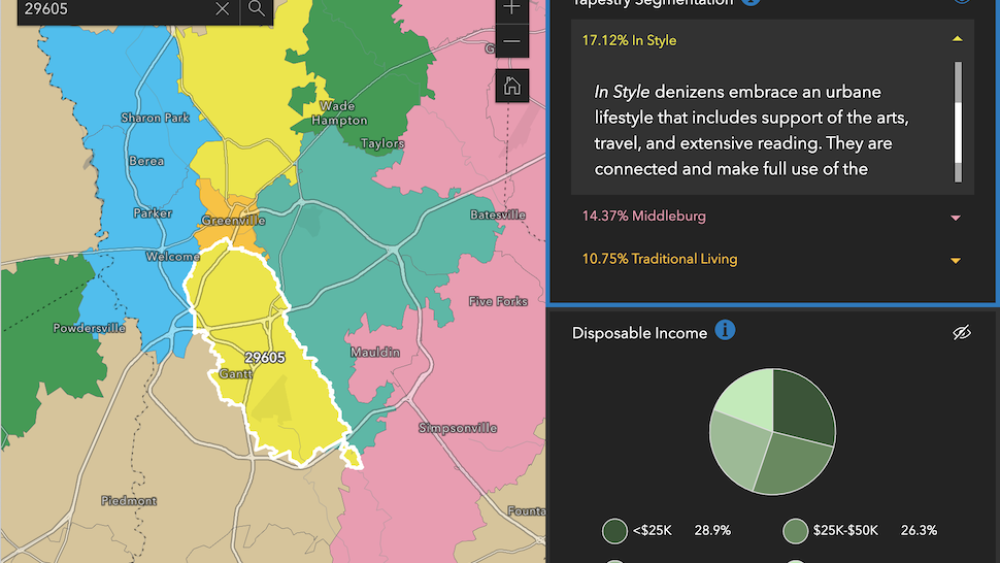
Want to know if your zip code screams small town simplicity, in style, or young and restless?
You can discover what your neighborhood trends say about you with Esri’s interactive Tapestry map. The tech company analyzes zip code data to define the characteristics of individuals in neighborhoods using a process called segmentation.
How it works
This tool sorts areas into 67 unique categories, or segments, based on demographics and socioeconomic characteristics such as age, income + population — AKA, it tells us generally who we are and what we have in common with our neighbors.
Users can input zip codes or click around the map to explore segments that best describe a particular area. In most cases, the results show the top 3 segments that define a neighborhood.
For example, you’ll discover groups like metro renters (educated, highly mobile 30-somethings) and the young and restless (young, educated workers employed in professional or technical occupations).
Greenville’s tapestry
- The city’s downtown core is largely defined as modest income homes + metro renters.
- The zip codes that make up Mauldin, Simpsonville, and Five Forks are classified as workday drive + middleburg — with a little bit of “country flavor.”
- The 29607 + 29615 zip codes (kinda headed out of town down I-385) are young + restless (no, not the soap opera) with a median age of 29.8.
- If you head out towards Easley + Powdersville, Esri categorizes the 29642 as a green acres area with plenty of do-it-yourselfers.
Outside of the segmentation tool, you can do a deeper dive into trending habits based on zip code, right down to shopping preferences + credit card debt.
Ready to explore your own neighborhood? Check out the map and let us know below if the tool has your personality and lifestyle pegged.
Poll


